Dashboard
he dashboard gives you an overview of all the devices currently sending data to this account.
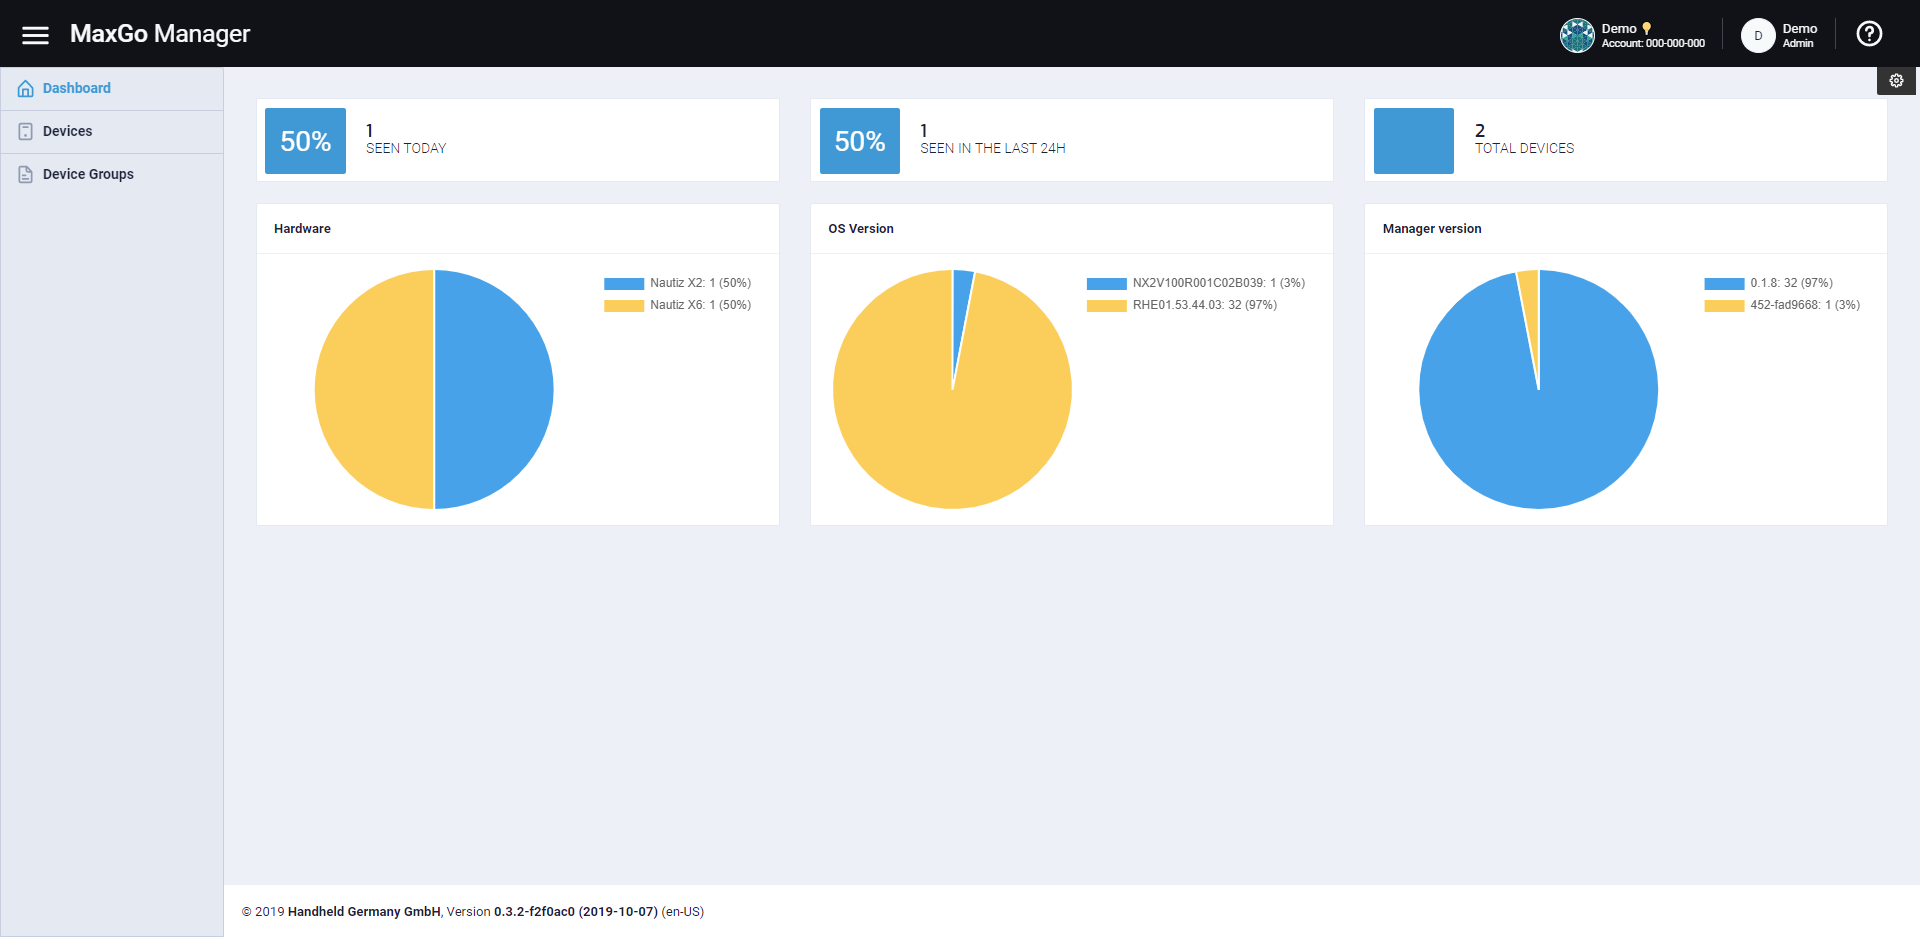
The 3 blocks as the top indicate the number of devices that have contacted the server within a certain time window.
- The first block shows the number of units seen since midnight of the current day
- The second block shows the number of units seen within the last 24 hours
- The last block shows the number of units ever seen on this account
Below that, you see several charts. The default charts show the distribution of the device hardware, installed OS version and installed Manager app version across all devices. It is possible to change the default charts and display other data. Please see the section on ”Customize the dashboard charts” on how to do that.